RECOVERING CISCO NEXUS 3000 SERIES SWITCH USING A TFTP SERVER

INTRODUCTION

Cisco Nexus 3000 Series Switches are designed for data center top-of-rack deployments by providing 24 to 128 ports offering flexible connectivity, high performance, and a comprehensive feature set. It usually runs on multiple versions of OS images including 6.2a, 6.3a, 6.8, 7.3 and many others.

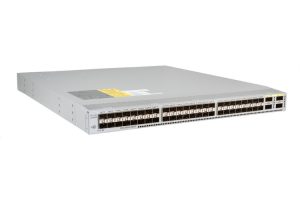
Figure 1: Nexus 3000 series switch

TFTP (Trivial FTP), is a file-transfer protocol geared towards a much simpler, and thus less robust, set of needs as far as file transfers go. TFTP is ideal for transferring of firmware updates, moving system images around, and other tasks that require far more functionality than the traditional FTP. It operates on UDP port 69.

In this article, we are going to recover a Cisco Nexus 3000 Series Switch using images installed on a TFTP server.

SIGNS OF A FAULTY NEXUS SWITCH

  • Continuous booting,
  • Cannot load Operating system image,
  • Cannot read USB drives.

PREREQUISITES

  • In this article, the TFTP server IP address is 168.10.10/24.
  • Ensure the kickstart and main images are stored in the TFTP server and set the TFTP server to use the directory or folder where the files are located.
  • In this article, we shall use n3000-uk9-kickstart.6.0.2.U5.3.bin as our kickstart image and n3000-uk9.6.0.2.U5.3.bin as our file image.


SETTING UP THE TFTP SERVER.

In this article, a Debian-based Linux server with UFW firewall was used to set up the TFTP server as root user.

NB: The configuration on the server IP address is beyond the scope of this article.

  • Install the TFTP server.

# apt-get -y update && apt-get install -y tftp-hpa

  • Configure the TFTP server.

# echo ‘TFTP_USERNAME=”tftp”‘ > /etc/default/tftpd-hpa

# echo ‘TFTP_DIRECTORY=”/srv/tftp”‘ >> /etc/default/tftpd-hpa

# echo ‘TFTP_ADDRESS=”0.0.0.0:69″‘ >> /etc/default/tftpd-hpa

# echo ‘TFTP_OPTIONS=”–secure”‘ >> /etc/default/tftpd-hpa

  • Copy the Cisco recovery images (assuming they are in the current working directory) to the TFTP directory

# cp -n n3000-uk9-kickstart.6.0.2.U5.3.bin /srv/tftp

# cp -n n3000-uk9.6.0.2.U5.3.bin /srv/tftp

  • Start the TFTP service

# systemctl start tftpd-hpa

  • Allow traffic to the TFTP port.

# ufw allow to any port 69


RECOVERING THE NEXUS SWITCH

  • Connect the switch’s Management (MGMT) port (by the power supply) to the network where the TFTP server resides.
  • Configure the switch’s IP reachability using the management port to be able to communicate with the TFTP server.

loader> set ip 192.168.10.4 255.255.255.0

loader> set gw 192.168.10.1

  • Boot the kickstart image file from the TFTP server.

loader>boot tftp://192.168.10.10/n3000-uk9-kickstart.6.0.2.U5.3.bin

  • After a successful boot, you will be directed to the (boot)# From here, you can check whether the boot flash is empty. If empty, copy the files (kickstart image, main image, and license file) over from the TFTP server.
  1. NB. You may need to format the bootflash in case of corrupted condition.
  • If all is well, then copy the kickstart and main image files using the following commands:

switch(boot)#copy tftp://192.168.10.10/n3000-uk9-kickstart.6.0.2.U5.3.bin bootflash:/n3000-uk9-kickstart.6.0.2.U5.3.bin

switch(boot)#copy tftp://192.168.10.10/n3000-uk9.6.0.2.U5.3.bin bootflash:/n3000-uk9.6.0.2.U5.3.bin

  • Verify that both images are in the bootflash using the command:

switch(boot)#dir bootflash:

  • See if the switch is able to boot up using the main image.

switch(boot)#load bootflash:/n3000-uk9.6.0.2.U5.3.bin

  • During the boot, you will be asked whether you would like to enter the initial configuration mode, type This will lead you to the basic configuration, you can then verify your configuration present using the command “show running configuration” in configuration mode.

switch#show running-config

  • Go ahead and reload the switch to ensure that the switch is able to boot up normally.

switch#reload


FURTHER READING

Ping Plotter

Ping Plotter

This is a tool used by the RENU community to troubleshoot network issues. Once an institution is facing problems they are prompted to share their results with the NOC for interpretation. The big question is do you understand these graphs.

This write-up covers the basic features of the graphs and their interpretation.

You’ve captured something in PingPlotter that looks like evidence of a network problem. Let’s take a closer look and see what the graph tells us about the source of your network problem.

Understanding PingPlotter graphs begins with the final destination. That’s the target you’re testing. PingPlotter represents the final destination with the bottom row of the trace graph.

The final destination is the bottom row of the trace graph

Check for packet loss

Take a look at your PingPlotter results. Do you see a red bar? If so, that means some data was lost between your computer and the target. This effect is known as packet loss, and if you’re seeing it on the final destination, there’s a good chance you captured a problem.

Check for latency

What about the black line? It shows how long it takes data to travel to your target and back. This measurement is known as latency. It’s another network problem indicator. The further to the right the black line is the longer it takes for data travel around the network. If you see high latency on your final destination, you’ve probably captured a network problem

Follow the pattern to the source

When you have an idea of what’s happening on the final destination, it’s time to look at the rows leading up to the final destination. Do you notice any patterns leading up to the final destination?

Where the pattern begins, helps you understand the source of the problem. If the pattern starts on the first row in the graph (your router), you’re probably dealing with an internal network problem.

Figure 1 Internal problems begin on the first hop

If the pattern originates somewhere in between the first and last row, the problem is probably outside your local network then contact the NOC it could be problems on the international circuit

Figure 2 Problems outside your network begin in the middle.

.It’s time to make a diagnosis. Do you think the source of your problem is on your local network, or it is it outside your local network?

Wireless Problems

Sometimes other devices interfere with your wireless network. If you connect with ethernet (the cable) and the problem goes away, you probably have a wireless issue.

Bandwidth

Bandwidth problems happen when your network usage exceeds your capacity. If your network problem happens during network-intensive activities like gaming, downloading, or multiple users, there’s a good chance you have a bandwidth issue.

Hardware

When network devices fail, it’s a hardware problem. If you don’t think you’re dealing with bandwidth or wireless issue, it’s time to start looking into hardware.

All the examples above can be categorised as Internal network issues. If you suspect more that the problem is outside your local network contact the NOC.


Optical ByPass Switching

Optical Bypass Switches

bypass switch (or bypass TAP) is a hardware device that provides a fail-safe access port for an in-line active network device such as an intrusion prevention system (IPS), next-generation firewall, network switch etc. if the device loses power, experiences a software failure, or is taken off-line for updates or upgrades, traffic can no longer flow through the critical link. The bypass switch or bypass tap removes this point of failure by automatically ‘switching traffic via bypass mode’ to keep the critical network link up.

A bypass switch has four ports. Two network ports create an in-line connection in the network link that is to be monitored. This connection is fully passive; if the bypass switch itself loses power, traffic continues to flow unimpeded through the link.

Two monitor ports are used to connect the in-line device. During normal operation, the bypass switch passes all network traffic through the network (CPE) switch as if it were directly in-line itself. But when the switch (CPE) loses power, is disconnected, or otherwise fails, the bypass switch passes traffic directly between its network ports, bypassing the CPE, and ensuring that traffic continues to flow on the network link.

A bypass switch monitors the health of the CPE by sending heartbeats to the network switch (CPE) as long as the network device/switch is on-line, the heartbeat packets will be returned to the optical bypass switch and the link traffic will continue to flow through the CPE.

If the heartbeat packets are not returned to the Optical Bypass Switch (CPE has gone off-line), the Optical Bypass will automatically bypass the CPE and keep the link traffic flowing. The Optical Bypass also removes the heartbeat packets before sending the network traffic back onto the critical link.

Installing and configuring cacti on ubuntu to monitor the network

In a recent article, http://“https://blog.renu.ac.ug/index.php/2020/06/17/using-Cacti-to-monitor-your-bandwidth-consumption/”, we learnt how to monitor bandwidth consumption using Cacti and the assumption was that your service provider had given you access to their own Cacti tool which they use to monitor your consumption.

In this article, we shall learn how to install and configure Cacti on your own server either on premise or in the cloud.

Our installation focus is going to be on Ubuntu though it could also be installed on Windows which requires installation of a lot more software as compared to Linux. If you want to install on windows use the link below,

“http://“https://subscription.packtpub.com/book/networking_and_servers/97817 88299183/1/ch01lvl1sec11/installing-Cacti-on-a-windows-system”

With your own Cacti you will be able to monitor not only the bandwidth consumption but also the state (up or down) of your devices and how long they have been in that state.

Continue reading “Installing and configuring cacti on ubuntu to monitor the network”