Introduction
SmokePing is a powerful and flexible open-source tool designed for monitoring latency, jitter, and packet loss across network paths. One of its most impactful use cases is tracking provider-level paths, especially valuable for organizations with multi-homed connections that demand high availability and performance insight.
In this blog, we will guide you through the process of using SmokePing to monitor multiple provider paths, ensuring redundancy, performance optimization, and rapid detection of upstream issues with minimal service disruption.
How SmokePing works
SmokePing monitors path health by sending multiple probes at set intervals to carefully chosen targets beyond each provider’s network. This approach ensures that the measurement reflects not just whether a provider’s link is up, but also how well it performs when carrying real traffic across its routes. The tool collects latency, jitter, and packet loss data, then turns it into graphs that make performance issues easy to spot.
In these graphs, the “smoke” represents jitter, showing how stable or unstable the provider’s latency is over time. A faint, thin smoke trace indicates consistent latency and a stable connection, while a thicker, darker cloud reflects greater variation in packet delay (jitter) and possible performance issues. Packet loss is shown through background colors: green means the provider returned all probes without loss, blue shows minor loss with only a few dropped packets, purple indicates severe loss with most probes failing, and red means the provider path was completely unreachable.
By mapping performance in this way, SmokePing provides a clear picture of each provider’s reliability, enabling you to compare paths, identify congestion, and pinpoint when a provider may be struggling to deliver a stable connection.
Core SmokePing Workflow
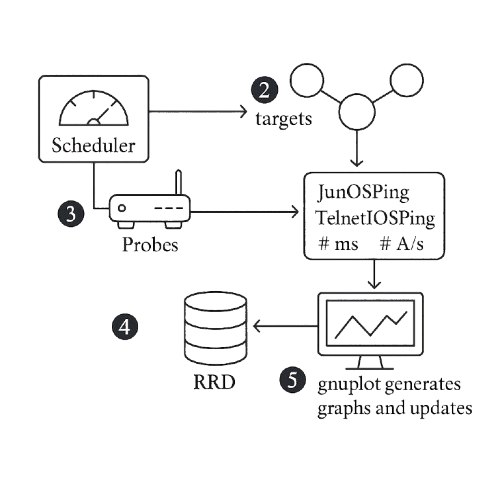
Scheduler
SmokePing’s built-in scheduler utilizes a CRON-like configuration to initiate probes at regular intervals (e.g., every 60 seconds). You define “Probes” in the configuration, each targeting one or more hosts or services you want to monitor.
When using SmokePing to monitor provider-level paths, the choice of time interval directly impacts how quickly you capture performance issues along those upstream routes.
- Short intervals (30–60 seconds) allow you to see momentary jitter, latency spikes, and micro-outages that may occur on a provider’s backbone. This level of granularity is valuable when troubleshooting user complaints or monitoring services that depend on consistent packet delivery. The drawback is higher probe load and noisier graphs, which may be difficult to sustain across multiple providers.
- Long intervals (5–10 minutes) smooth out the noise, making it easier to identify broader performance patterns such as recurring congestion during peak hours. They reduce overhead on the probe and devices, but shorter disruptions on the provider path can slip by unnoticed.
For provider-level monitoring, a 5-minute interval with multiple pings per round is generally the most effective. It captures meaningful patterns for SLA verification and trend analysis while keeping system overhead reasonable. For critical provider links where jitter visibility is essential, you can complement this with shorter-interval probes running in parallel to catch finer-grained instability.
Probes Dispatch
The scheduler invokes the probe processes (e.g., JunOSPing, TelnetIOSPing, or custom plugins). These probes send ICMP pings, DNS queries, HTTP requests, or any supported probe to the defined targets and measure round-trip times, packet loss, and other statistics.
Data Collection
Each probe writes its latency and packet-loss measurements to a dedicated Round-Robin Database (RRD). RRDs efficiently store time series data at fixed intervals, automatically rolling off older data to maintain a constant database size.
Graph Generation
After updating the RRDs, SmokePing invokes gnuplot to read the recent data and render PNG graphs. These graphs plot min/avg/max latency, packet loss spikes (“spikes”), and customizable thresholds, producing the iconic “smoke trails” on a time axis.
Web Interface and Alerts
The generated graphs are served via a lightweight web interface. You can configure alerts (email or scripts) based on latency/packet-loss thresholds, so SmokePing can notify you if a link degrades beyond acceptable parameters.
Over time, the continuous cycle of probing, storing, graphing produces a live, visual history of network performance, making it easy to spot trends, intermittent outages, and degradation “spikes.” The above diagram animates these five steps in a clean, sequential flow.
Why Monitor Provider-Level Paths
The main motivations include:
- Redundancy & Failover Readiness: Spotting upstream provider issues before they affect end-users
- Performance Optimization: Understanding which provider offers lower latency and jitter in real time.
- Troubleshooting: Isolating performance bottlenecks outside your internal network.
- Reporting: Supporting provider SLA discussions with factual data.
Spotting Clean vs. Degraded Link
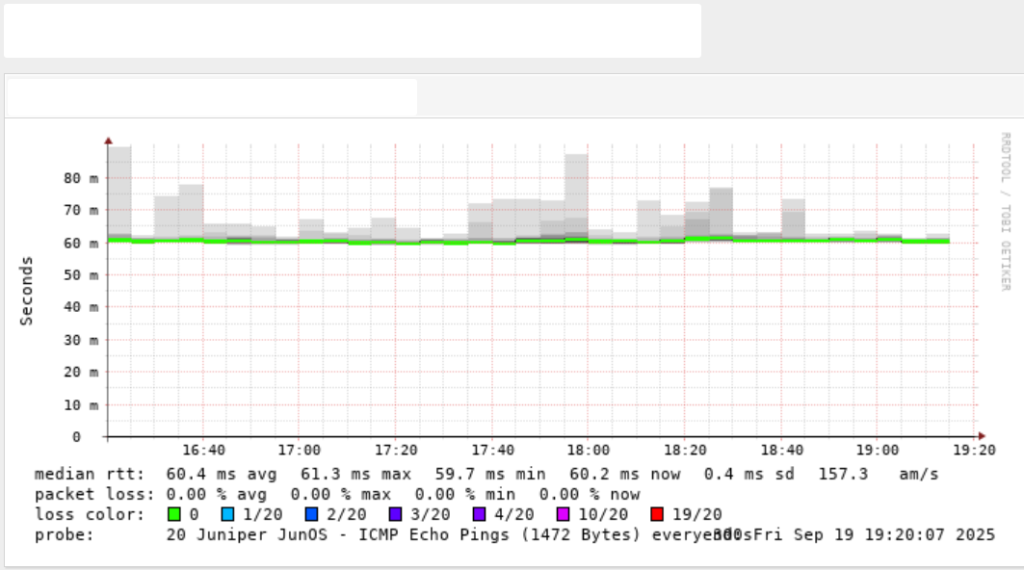
Clean link
- Median RTT: 60 ms, stable across the graph.
- Smoke (Jitter): Very light and thin, hovering close to the median line, shows consistent latency.
- Packet Loss: 0% (no red blocks or gaps).
- Interpretation: This is a good link, meaning latency is steady, jitter is minimal, and there is no packet loss.
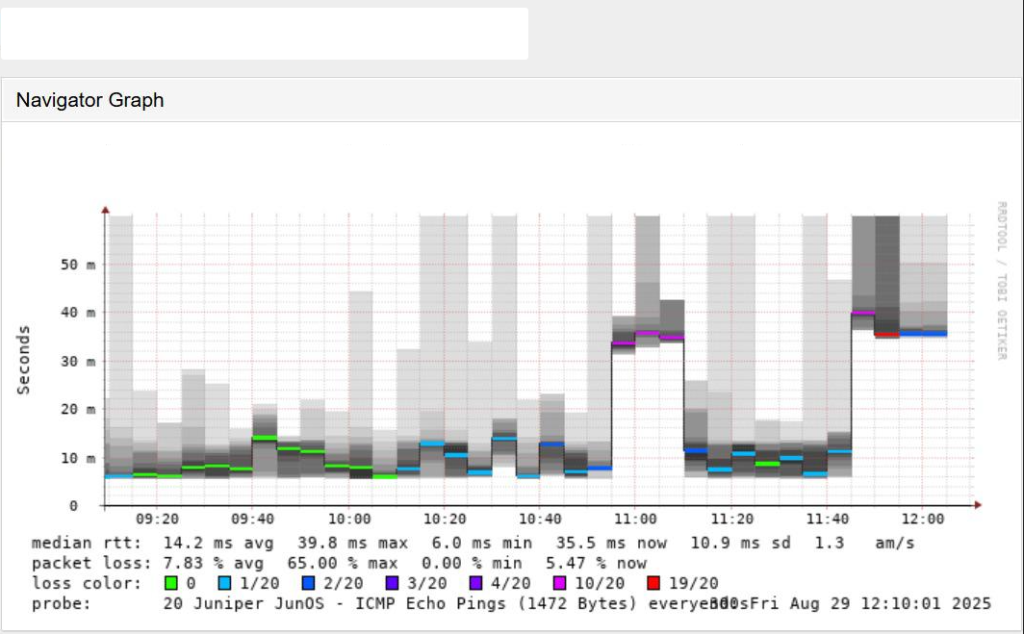
Degraded Link
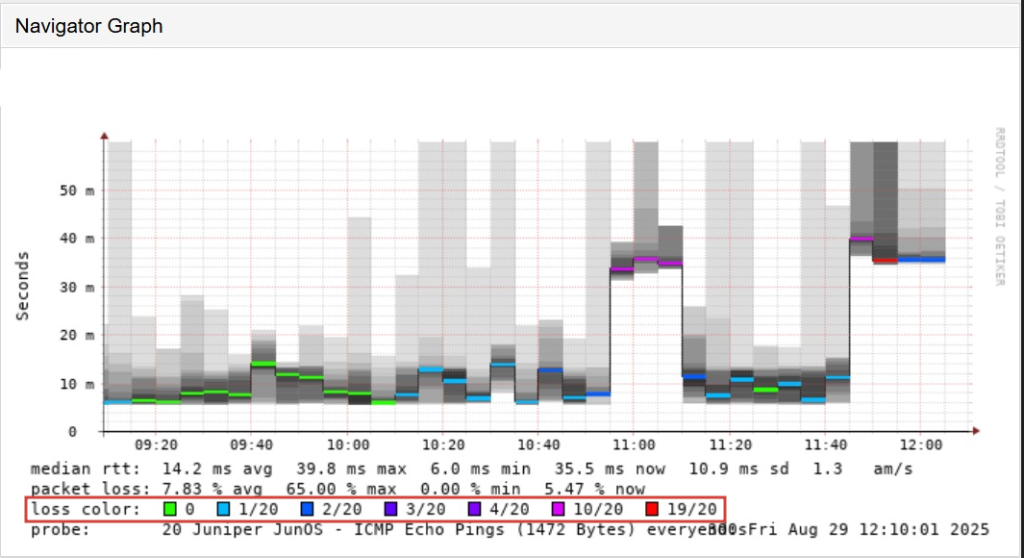
- Median RTT: Starts 14 ms but fluctuates up to 40 ms.
- Smoke (Jitter): Thick, dark, and widely spread, large variation in RTT (unstable).
- Packet Loss: Average 7.8%, peaks up to 65% (visible as colored/red blocks).
- Interpretation: This is a bad link due to the unstable latency, high jitter, and significant packet loss, which would heavily impact real-time traffic like VoIP or video.
SmokePing makes it easy to spot healthy vs. failing provider paths. Good (Clean) links have stable latency, faint smoke (low jitter), and no packet loss, making them reliable for real-time traffic. Degraded links exhibit fluctuating latency, thick smoke (high jitter), and packet loss, indicating instability.
Preparing Your Environment
Before diving into configuration, make sure:
- You have a dedicated server or VM to host SmokePing (Debian or Ubuntu preferred).
- You have multiple provider paths accessible via different interfaces or routing configurations.
- DNS is correctly resolving for all monitored hosts.
- Apache/Nginx is set up if you wish to view results through a web interface.
Install SmokePing
Refer to the link below for a detailed guide on installing SmokePing.
https://nsrc.org/workshops/2017/caren-cndo/networking/cndo/en/labs/smokeping_install.html
SmokePing Configuration Steps
Define Provider Targets
Create separate target entries for each provider-level path you want to monitor.
Example:
If you have two upstream providers (ISP A and ISP B), and your router routes traffic to Google differently depending on the provider, create distinct tests using source routing or different interfaces.
Configuration for Provider Paths
In the Targets File:
+Providers
menu=Providers
title= Upstream Provider Monitoring

++Google-ISPA
menu= Google via ISP A
title= Google via Provider A
host= 8.8.8.8
sourceaddress=192.0.2.2

+++Google-ISPB
menu= Google via ISP B
title= Google via Provider B
host= 8.8.8.8
sourceaddress=198.51.100.2
Adjust source address to reflect the internal IP assigned to the interface connected to each respective provider.
Granular Monitoring with SSH-based Probes
For provider-level path monitoring, where ICMP-based methods may be insufficient or blocked due to routing policies or firewall rules, SSH-based probes offer a robust alternative. These probes execute ping commands directly from the remote device, providing visibility into the provider-facing interface and real-time metrics from the device’s perspective.
- Use JunOSPing (based on
OpenSSHPing) for Juniper devices. - Use TelnetIOSPing or related probes for Cisco IOS routers.
Using JunOSPing, you gain latency and loss metrics from inside the router, right at the edge where your network hands off to an upstream provider. This is especially useful for:
- Diagnosing asymmetric routing or upstream congestion
- Verifying SLA compliance with transit providers
- Monitoring multi-homed connections with greater precision
For Cisco environments, a similar method can be achieved with TelnetIOSPing, assuming Telnet is enabled and accessible on the device, though SSH-based alternatives are more secure and recommended.
Configuration Overview
In the probes file:
+JunOSPing
binary = /usr/bin/ssh
junosh_user = monitor
junosh_key = /etc/SmokePing/keys/id_rsa
junosh_ping_args = rapid count 5
In the targets file:
+ProviderLevel
++JUN-RTR-UP1
probe = JunOSPing
host = 198.51.100.1
Enhancing Data Collection with Alerts
To proactively detect issues, configure SmokePing alerts. Define thresholds for packet loss, latency, and RTT deviation.
Example alert config in Alerts:
+lossdetect
type = loss
pattern = >5%,*5%,*5%
comment = Packet loss >5% for 3 consecutive measurements
Bind this alert to your provider targets in Targets:
alerts = lossdetectYou can configure email notifications for alerts by editing ~/.SmokePing/config and integrating a mail service like msmtp.
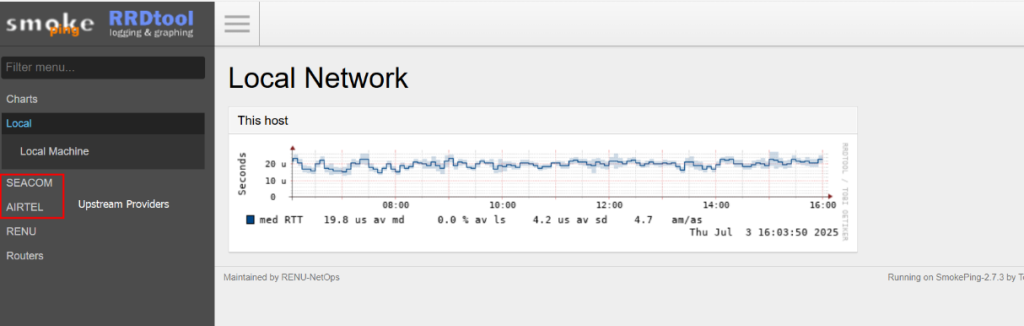
Viewing & Interpreting Results
Access your SmokePing dashboard:
http://yourserver-ip/SmokePing
You’ll see graphs for each provider path, including:
- Round Trip Time (RTT)
- Packet loss
- Latency variations
This provides a real-time comparative view of your providers.
You can hover over the graphs to see historical RTT spikes, loss patterns, and jitter. Colour changes indicate deviation from baselines.
Automating and Extending
Some useful extensions include:
- Email or webhook alerts to notify your team.
- Integrate with Grafana for advanced visualizations using
SmokePing2rrd. - Use curl or dig probes to monitor HTTP/DNS performance through each provider.
To integrate SmokePing with Grafana, export RRD data using SmokePing2rrd, then import it into a time-series DB like Graphite or InfluxDB for visualization.
Going Live: Best Practices
Before fully relying on SmokePing:
- Validate path routing using
tracerouteormtr. - Confirm that firewalls or ISPs aren’t rate-limiting ICMP or affecting probe results.
- Run SmokePing in parallel for a few days before using it for live decisions.
Conclusion
Monitoring provider-level paths with SmokePing ensures your organization is not flying blind when it comes to upstream performance. By actively comparing multiple paths, you gain data-driven insight into latency, packet loss, and failover readiness. Whether you’re balancing between providers or holding one accountable, SmokePing offers a clear window into the otherwise invisible.
By leveraging SmokePing for provider-level monitoring, you transform an opaque part of your network stack into a transparent, actionable source of insight.