Cacti is a free network graphing tool that is used to visualize the time series data obtained by the Round-Robin database tool (RDD tool).
The tool polls network devices like switches and routers via SNMP and then graphs their data. Some of the data that are polled are CPU load, temperature, uptime and network bandwidth utilization. 
Here we shall focus on how you can monitor your bandwidth from the cacti graphs.
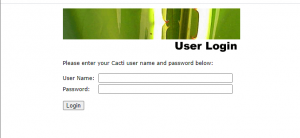
Suppose your service provider gave your access to the cacti graphs to visualize your capacity. The SP would give you a link to cacti as well as the login credentials. The login interface would be as shown below;

After login, you would then be able to visualize your cacti graph either in preview mode using an icon on the extreme right ![]() or the list view
or the list view ![]() which is just next to the preview mode.
which is just next to the preview mode.
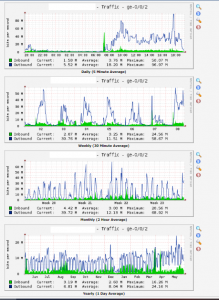
In the preview mode, you can visualize your current consumption both inbound (in green) and outbound (in blue) as illustrated below.

Your can also visualize your previous consumption by adjusting the time and date using the dropdown and textboxes next to present.

In the list view, you can visualize all attached graphs in list form and when you click on a particular graph, it displays all the daily, weekly, monthly and yearly graphs. You can view your current utilization from the first graph. The outbound shows the traffic from the LAN and inbound shows traffic coming to the LAN through a particular interface.

How do you know that you using all your bandwidth?
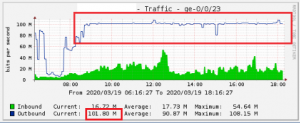
Suppose you subscribe for 101Mbps, when you are maximizing or using all your bandwidth the graph will become flat and it would not go beyond 101M. Your inbound or outbound value would also be equal to the bandwidth you subscribe for.

One of the major cons of maximizing is that the internet will become very slow that it might become hard to load even website pages. Therefore the first step when you are experiencing slow speed is to check your cacti graph to see if you are using all your bandwidth. If you are maximizing, try scanning your network to see what could be using up your bandwidth if you are not aware of any activity but if you not maximizing and experiencing slow speeds please contact your service provider to assist you check what could be causing the slowness
If your provider doesn’t give access to cacti graph, in the next article we shall learn how to install and setup cacti on your network

